| P6.7 |
|
|
|
1. INTRODUCTION
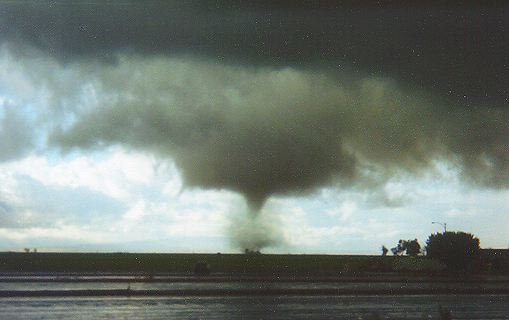
At approximately 1505 PST (2305 UTC) 22 November 1996, a tornadic thunderstorm struck Lemoore Naval Air Station in the San Joaquin Valley of California (see Fig. 1 for locations). Two tornadoes were associated with the storm. The first tornado occurred about 1.6 km (1 mile) from Lemoore at 1427 PST (2227 UTC), caused no damage (USDC 1996) and was rated F0, although photographic evidence suggests that is was likely of F1 intensity (Fig. 2). The F1 Lemoore tornado caused substantial damage to electrical utility lines and poles and significant damage to building roofs and fixed structures as it tracked through the administration portion of the base (USDC 1996). Hail up to 6.3 cm (2.5 ") in diameter also caused vehicular damage in the area (USDC 1996).
Fig. 1. Location map. Shaded area indicates Central Valley locations including the San Joaquin Valley. The location of the WSR-88D radar at KHNX is shown.
This storm (hereafter referred to as "the Lemoore storm") may be the best-documented California tornadic storm to date. Since the tornadoes occurred very near the WSR-88D radar at Hanford (KHNX), the structural evolution of the parent storm can be easily deduced. Prior to the implementation of the WSR-88D network in the middle 1990s, studies in the referenced literature on California tornadic storms were largely inferential. Although detailed subsynoptic and synoptic analyses were included, conclusions about storm type and evolution were made on the basis of thermodynamic and shear considerations and not supported by analyses of WSR-88D radar information. This is the first study to document a tornadic thunderstorm based upon a careful and detailed analysis of all available information.
The present study has two purposes. First, the intent is to provide a complete case study, in which detailed analyses of the synoptic, subsynoptic and dynamic controls of the event is presented. In addition, the structure and evolution of the storm will be examined using analyses of high-resolution satellite imagery and the Doppler radar information from KHNX.
In addition, the controls on the Lemoore storm will be examined on the basis of the latest knowledge about the role of buoyancy and shear in the development of tornadic storms in general. A key focus of the study will be the degree to which the buoyancy and shear associated with the Lemoore storm is either different or similar to such storms observed elsewhere. The study will also establish if this storm fits the paradigm for Central Valley storms in general (Monteverdi and Quadros 1994; Monteverdi et al. 2000).
2. DYNAMIC AND THERMODYNAMIC CONTROLS ON THE LEMOORE STORM
2.1 Dynamic Controls
At 1200 UTC 22 November 96, a highly mobile middle- and upper-tropospheric
short-wave trough moved around the base of the long-wave trough
into Central California. The resulting quasi-geostrophic vertical
motions were evident on the 1200 UTC 700-mb vertical velocity
field analysis (not shown) as an wide area of moderate upward
motion centered over KSFO (maximum —8 m b![]() ) which,
noting that the short wave trough was progressive, moved into
the Central Valley in the late morning (~1900 UTC).
) which,
noting that the short wave trough was progressive, moved into
the Central Valley in the late morning (~1900 UTC).
The primary effect of the passage of the short-wave trough during the late morning hours was the initiation of multicellular convection in the Central Valley (both the Sacramento and the San Joaquin Valleys). It also further destabilized the environment by dynamically induced layer lifting, decreasing the environmental lapse rates, while increasing the buoyancy of convective motions, just before the time of peak diurnal warming.
The main factor that caused developing storms in the Central Valley to become severe was increased deep-layer wind shear associated with the strong jet stream winds aloft. By 0000 UTC 23 November 1996, the 500-mb the short-wave trough had weakened as the long-wave trough progressed southeastward into Arizona in response to a ridge building 640 km (400 mi.) west of KSFO. But the left-front divergent quadrant of a 300-mb 80-knot jet streak had moved over the San Joaquin Valley, producing strong northwesterly flow aloft (Fig. 3).
Fig. 3. PC-Grids analysis of ETA model 300—mb heights (dam, solid) and winds (x10 knots, dashed) for 0 UTC 23 November 1996. Areas of winds greater than 80 knots are shaded.
Strong middle and upper tropospheric westerly and northwesterly flow, respectively, had simultaneous effects on the wind shear environment. First, low-level cross-mountain flow with the Coast Range caused a topographically-induced mountain lee-side trough to develop in the Central Valley that produced a southerly pressure gradient at the surface and lowest levels. The low-level southerly winds, together with the mid- and upper-level jet streak over the San Joaquin Valley, strengthened the deep-layer wind shear, and pushed the 0—6 km positive shear values into supercell range. Convection that developed north of the jet streak in the Sacramento Valley had weak deep-layer shear, and therefore, was multicellular in nature. In the San Joaquin Valley including Lemoore, the passage of the jet streak enhanced the deep-layer shear, and thus, increased the risk of splitting storms and deviant supercells.
2,2 Thermodynamic Controls
Fig. 4 is a simulated sounding obtained on the Sounding Hodograph Analysis and Research Program (SHARP) (Hart and Korotky, 1991) by modifying the 1200 UTC KOAK sounding with the surface temperature and dewpoint temperature from KNLC at 2227 UTC. A hodograph was also produced on SHARP, but using the KHNX Vertical Azumith Display (VAD) profile at 2234 UTC (Fig. 5) –the time of the initial F0 tornado . CAPE was calculated on the basis of a surface lifted parcel.
Fig. 4. Proximity sounding for KNLC at 2234 UTC 22 November 1996. Dashed line shows surface lifted parcel.
Comparisons of rotational and convective parameters between the initial 12 UTC KOAK sounding and hodograph with the proximity sounding and hodograph for KNLC is given in Table 1. A surface-based lifted parcel on the KOAK sounding had typical convective values for a cold sector environment (Monteverdi and Quadros 1994). The 1200 UTC KOAK hodograph (not shown) shows a small veer of the wind shear vector indicated by a slight clockwise curvature of the hodograph, although in the lowest 4 km, the hodograph is essentially straight. SHARP obtained 0-1 km, 0—3 km, and 0—6 km wind shear values, and the 0—3 km storm-relative environmental helicity (SREH), are relatively weak and not in the range observed with rotating storms. With an essentially straight hodograph and weak deep layer shear, any developing convection in the valley would likely be multicellular in nature.
The simulated KNLC sounding (Fig. 4) contained moderate instability
and convective values observed for severe storms elsewhere in
the country (Weisman and Klemp 1986). The hodograph (Fig. 5) now
has a clockwise curvature in the lowest 4 km due to increased
low-level veering of the wind shear vector. An increase in the
positive shear and helicity values has also occurred. The 0—1
km, 0—3 km, and 0—6 km positive wind shears (see Table
1) are in the range of observed values that is conducive to mesocyclone
development (Weisman and Klemp 1982). Furthermore, Davies-Jones
et al. (1990) advised that a SREH value of 225 ![]() , is
not only in the range for developing mesocyclones, but also for
the genesis of weak tornadoes [151—299
, is
not only in the range for developing mesocyclones, but also for
the genesis of weak tornadoes [151—299 ![]() ]. With
a BRN of 15, the Lemoore storm also fits the paradigm for BRNs
associated with classic supercells (15—45) observed in moderately
buoyant (CAPE ~ 1500 J/kg) environments (Weisman and Klemp 1982).
]. With
a BRN of 15, the Lemoore storm also fits the paradigm for BRNs
associated with classic supercells (15—45) observed in moderately
buoyant (CAPE ~ 1500 J/kg) environments (Weisman and Klemp 1982).
The passage of the upper tropospheric jet streak (as discussed in the previous section) increased shear at all level in the San Joaquin Valley. North of the jet streak, where deep layer shear was weak, multicellular storms developed (see Fig. 6) along the lee-side trough and storm motion was parallel to the mean tropospheric flow. In the region near the left-front quadrant of the jet streak, shear values were in the range for supercells, and thus splitting storms and the right-moving Lemoore supercell evolved (see Fig. 6). Therefore, the convective and rotational parameters associated with the Lemoore storm are consistent with the occurrence of an F1 supercellular tornado.
Fig.5. Hodograph for KNLC (winds at 1—km intervals) using VAD profiler data from KHNX at 2234 UTC.
Table 1. Convective and rotational parameters obtained on SHARP for the observed KOAK sounding 1200 UTC 22 November 1996 and the simulated KNLC sounding for 2230 UTC 22 November 1996.
|
|
1200 UTC KOAK | 2230 UTC KNLC |
|
|
-2 | -6 |
|
|
-2 | -6 |
|
|
435 | 1197 |
|
|
11.6 |
14 |
|
|
6.2 |
7.8 |
|
|
3.6 |
4.3 |
|
|
121 |
225 |
|
|
10 | 15 |
3. SATELLITE ANALYSIS
The GOES 9 1-km resolution visible satellite image for 2245 UTC 22 November 1996, coincides with the time of the developing F1 tornado (Fig. 6). By this time, the Lemoore storm had attained many mature supercell characteristics indicated on the visible satellite image (Fig. 6). A cirrus anvil (Fig. 6® A) denotes the location of a meso-high and outflow boundary. Other satellite-indicated supercell characteristics include a flanking line of towering cumulus southwest of the main updraft core (Fig. 6® B) and a stable evaporatively-cooled clear air dome (Fig. 6® C) immediately adjacent to the supercell. This clear air dome is the result of a cold air mass generated beneath the supercell echo due to evaporation of rain in the forward flank downdraft (FFD) and its subsequent movement away from its origin.
4. RADAR ANALYSES
The Lemoore storm was a unique event. Radar detection of storm structure similar to radar features of supercell storms found elsewhere is rare with California storms. Due to the close proximity with the WSR-88D at Hanford (KHNX), and a storm view that was not obscured by topography, the Lemoore storm had evident supercellular features on radar and probably represents the best case for radar analysis of a California supercell to date.
The reflectivity cross-section (Fig. 7) shows a tilted updraft vault (> 65—dBZ) with a echo top that extended over 11 km (>35,000 ft.) evidenced by reflectivity echoes greater than 34—dBZ. A well-defined bounded weak echo region (BWER) was indicative of a deep-layer mesocyclone (Fig. 7).
Fig. 6. GOES 9 1—km resolution satellite image for 2245 UTC 22 November 1996. Lemoore storm features include: (A) cirrus anvil; (B) flanking line of towering cumulus; (C) evaporatively-cooled clear air dome. The locations of San Francisco (KSFO) and Fresno (KFAT) are shown.
The 0.5° tilt base reflectivity from KHNX at 2234 UTC coincides with the occurrence of the F0 tornado (Fig. 8). Two reflectivity maximums (> 65—dBZ) identify the primary updraft core and a new updraft developing on the right flank of the storm. The new updraft is consistent with the flanking line of towering cumulus evident in on the 1—km visible satellite image (Fig. 6® B). A distinct hook echo is also evident with the storm. The 0.5° tilt storm relative velocity analysis for 2234 UTC (not shown) detected a mesocyclone and confirmed the presence of a storm relative velocity couplet. The cross-section of storm relative winds (not shown) also indicated a velocity couplet.
Fig. 7. Base reflectivity cross-section of the Lemoore storm from KHNX at 2206 UTC 22 November 1996.
Fig. 8. Base reflectivity at 0.5° tilt from KHNX at 2234 UTC 22 November 1996 showing hook echo.
5. CONCLUSION
The Lemoore Storm highlighted the significance of topographically-induced low-level wind shear (0-1 km) and jet-streak induced deep-layer shear (0—6 km) in contributing toward the development of supercellular tornadic events in California's Central Valley. Convective and rotational parameters for the Lemoore storm were consistent with those documented for previous F1/F2 supercellular events in California by Monteverdi et al. (2000). Finally, the synoptic pattern concurred with the prototype outlined in Monteverdi and Quadros (1994) .
6. ACKNOWLEDGEMENTS
The authors gratefully acknowledge Steven Mendenhall, MIC and Dan Gudgel, WCM, WFO Hanford for their steadfast cooperation in this project. All of the radar plots, photographs of the tornado and parent cumulonimbus, damage track, and official storm reports obtained for this study were provided by Mr. Gudgel. The authors also thank SOO Larry Greiss and all of the Lead Forecasters at WFO Hanford for their encouragement and help in this endeavor.
7. REFERENCES
Davies-Jones R. D., D. Burgess, and M. Foster, 1990: Test of helicity as a tornado forecast parameter. Preprints, 16th Conf . On Severe Local Storms Kananaskis Park, AB, Canada, A. M. S., 588—592.
Hart, J. A.,and J. Korotky,1991:The SHARP Workstation- A skew- T/hodograph analysis research program.NOAA/NWS NWSFO.
Monteverdi, J. P,, and J. Quadros, 1994: Convective And rotational parameters associated with three Tornado episodes in Northern and Central California. Weather and Forecasting, 9, 285—300.
Monteverdi, J. P., C. Doswell III, and G.S. Lipari, 2000Shear parameter thresholds for forecasting California tornadic thunderstorms. Preprints---20th AMS Conference on Severe Local Storms, this volume.
U.S.D.C., 1996: Storm Data-California, Vol. 38, no 11.National Climatic Data Center, Asheville, NC 28801.
Weisman, M.L., and J.B. Klemp, 1982. The.dependenceof numerically-simulated convective storms on vertical wind shear and buoyancy. Mon. Wea. Rev., 110, 504-520.